Module 4.1 Reading
It will be warmer tomorrow... The weather was very rainy yesterday... Temperatures will be 3°C above normal....
The weather is part of our daily lives. As soon as we listen to the radio, our ears are tuned in to know what the weather is going to be like and how we should dress.
Global warming, melting polar ice sheets, rising sea levels, record temperatures, decreasing greenhouse gas emissions...
The climate is also present in all media, it even mobilizes people in the street. But do we really know what climate is? And what is the difference between climate and weather?
Let's go back to the basics
Weather is the current atmospheric conditions, which is characterized by all the parameters that define the atmosphere: temperature, humidity, precipitation, cloud cover, etc...
These parameters can be evaluated by perception; we open the window and observe the weather at the moment. It is sunny, the sun is shining, there are many clouds
it is hot, it is cold...
We can also measure them with different instruments and thus obtain a scientific description of the weather. For example: This morning, it is 10°C in Liege, the atmospheric pressure is 1000hPa and the wind is blowing from the SW at 15km/h.
Weather is also the forecast of the weather for the next days. When we talk about climate. It is always about the atmosphere and its interactions with the land or ocean surface but the way of studying it and the time scales are completely different.
Climate is the succession of weather in a given place and over a ± long period of time, usually 30 years minimum. The climate is described according to statistical elements. For example: In Liege, over the 30 years climatic period, which we will call "climatic normal" 1981-2010, the average temperature was 9.9°C, it fall 882 mm of precipitation on average per year and it froze on average 57.7 days per year.
Let's recap:
Weather is an instantaneous concept and its evolution is directly perceptible by humans.
Climate is a statistical concept and its evolution is completely imperceptible by humans.
It is thanks to the methodical recording of the daily weather, over a long period, in the same place, that we will be able to evaluate climate and its changes.
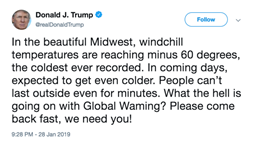
As you know now the differences between weather and climate, you can avoid misleading messages such as this one where President Trump did not hesitate to ask for global warming to come back to counter the arrival of a polar air mass on the USA. The arrival of a polar air mass is a fairly recurrent weather phenomenon over North America during the winter. While global warming is a slow increase of the annual average temperature at a global scale. Donald Trump therefore confused two very different scales of time and space: on the one hand, the daily time scale related to the arrival of cold air and, on the other hand, the time scale of global warming which corresponds to +1°C/100 years. There is also confusion between the regional spatial scale of the USA and the spatial scale of the whole Earth with respect to global warming.
So what is this "global warming"?
The Earth's atmosphere is made up of a set of gases and particles. Among these gases, there are gases called "greenhouse effect".
VIDEO→
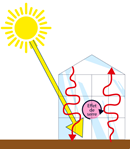
The principle of the greenhouse effect is simple. As in a gardener's greenhouse, the sun's rays penetrate the greenhouse through the glass and heat the interior of the greenhouse. However, the heat does not come out of the greenhouse, it accumulates inside. The temperature inside the greenhouse increases as the sun's rays penetrate it.
Exactly the same thing happens in the atmosphere, except that there is no glass but "greenhouse gases" that let the sun's rays through but trap some of the heat underneath. As a result, the air temperature at the earth's surface increases.
And fortunately! Because without this greenhouse effect, the temperature at the earth's surface would be -18°C. Life as we know it today would be impossible but thanks to the greenhouse effect, the Earth's equilibrium temperature is around +15°C.
Unfortunately, in this climatic machine, human activities have disturbed this balance between energy that enters the system and heat that remains trapped. The more than intensive use of fossil fuels since the beginning of the industrial era has released and is still releasing huge quantities of greenhouse gases, the most important of which is carbon dioxide, the famous CO2. Now, this CO2 is the greenhouse gas that most impacts on the greenhouse effect.
In reality, the more greenhouse gases are injected into the atmosphere, the more the atmospheric insulation layer is increased, and therefore the temperature under this layer also increases. It is a bit like if we increase the thermal insulation of the glass of the garden greenhouse by replacing for example the single pane of glass by a double pane of glass: The same quantity of solar radiation enters the greenhouse, but the heat produced inside accumulates even more and the temperature increases even more.
This is global warming!
And we can observe this warming since the beginning of the industrial era as shown in this figure: The dotted black lines represent the average of the period 1850-1900 and the black curves are the anomalies of 4 databases of observations compared to this average between 1850 and 1900. If we take the year 2020, we can see that on average it is 1.26°C warmer than the average temperature of the second half of the 19th century.
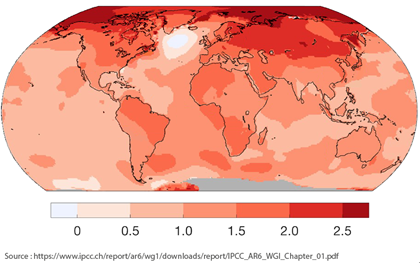
Let's now observe the anomaly of the global temperature in 2020 compared to this same reference period 1850-1900. We obtain the following map, which confirms an almost generalized warming on the whole planet.
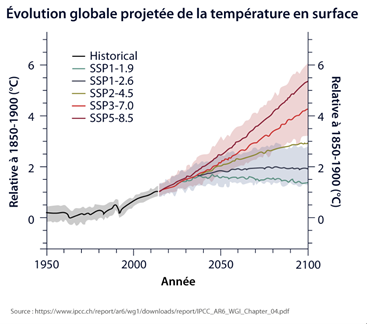
And that's not all! For the future, in 2050 or 2100, global warming will continue. The last IPCC report published several scenarios: scenarios of low future greenhouse gas emissions, i.e. the blue curves, scenarios of high greenhouse gas emissions, i.e. the reddish curves, and an intermediate scenario, i.e. the orange curve. With these scenarios, we can model the future evolution of the global average temperature and we obtain these curves for the different scenarios of anthropogenic greenhouse gas emissions. The scenarios with the lowest greenhouse gas emissions still show a global warming of +1.5 to +2°C for the end of the century, whereas the intermediate scenario suggests a warming of +3°C and the scenarios with the highest greenhouse gas emissions project a warming of +4 to +5°C for 2100.
Human activities emitting greenhouse gases have and continue to cause an imbalance in the climate system that results in global warming. But this warming is far from being the only consequence!
We live on a planet earth which is a complex system of interconnections where all the elements interact with each other and where the slightest disturbance destabilizes the whole system. Global warming is a perfect example of this.
The global atmospheric warming that the Earth has been undergoing for more than a century is not just a question of thermometer. Far from it. This degree of increase that we have undergone since the end of the 19th century is already showing impacts on the melting of the polar ice caps and glaciers almost everywhere in the world, on the melting of the permafrost, these permanently frozen soils beyond the Arctic Circle, on the rise of the sea level, on the intensification of some extreme events such as intense rains that can lead to record floods or the opposite, namely more and more frequent droughts, which has an increasing impact on our agriculture.
In short, global warming brings with it many consequences that we will explain in a next part of this module.