Module 4.4 Reading
We know that the world temperature has warmed up over the last century, that it makes the ice melt and that it makes the sea level rise until it covers some coastal areas. However, these consequences may seem far away, or at least far enough away that we don't really feel concerned.
However, global warming is not limited to a few regions of the world, it affects us all to varying significances. Let's review these regional disparities.
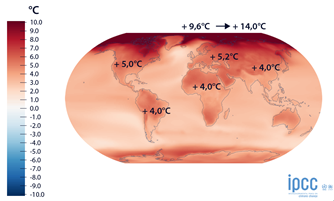
First of all, let's note that this global warming is of course not homogeneous on all regions of the planet. This map shows the projected warming for 2100 with the most warming scenario. We can read that the Arctic will be the region of the world that will warm the most by 2100 with an average of +9.6°C, but which could even reach +14°C in some places compared to the average of the period 1850-1900. It is con-si-dable! Still with this same scenario, Europe will experience a warming of +5.2°C, the USA +5°C, or +4°C for equatorial Africa, India and Brazil.
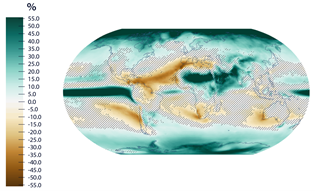
It is not only the temperature that will change, but also the annual precipitation amounts. In this case, the regional disparities are even more marked because some regions of the world will gain precipitation while others will lose it. Let's look at this map which represents the changes in annual precipitation amounts in percent, still with the most warming scenario and still for the horizon 2100. The hatched areas are areas with too much uncertainties to be able to make a statement on a change, but if we focus on the areas where the projections have a high degree of certainty, we can see that the polar regions once again, and more globally the regions beyond latitudes 60°N and S will gain precipitation on an annual scale, as will the intertropical band. On the other hand, some regions such as South Africa, southwestern Australia and the Mediterranean Basin will lose precipitation. The Mediterranean basin will lose an average of 20% of annual precipitation, but some regions such as northern Africa may lose up to 40%. It is easy to imagine that these changes will greatly affect local ecosystems, including human populations and agriculture.
We have just seen the changes in the two most important variables used in weather and climatology, namely temperature and precipitation. But if the annual average is affected by global warming, so how will be the extremes. Let's now look at the evolution of these extremes.
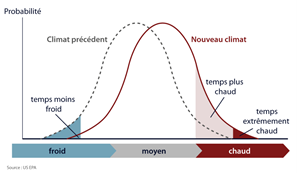
Concerning the temperature, we can consider that there are two extremes, a hot extreme and a cold extreme as we can see on this schematic curve of the temperature distribution. Since the greenhouse effect acts 24 hours a day, all year round, global warming affects also the whole temperature distribution. Thus, global warming will cause this statistical temperature distribution curve to shift to the right, towards warmer temperatures. This shift leads to an increase in the average temperature, but also to an increase in the extremes: the cold extremes will become milder (and then less frequent for an already observed event), and the hot extremes will become hotter (and then more frequent).
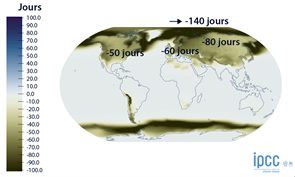
The number of frost days, i.e. the number of days with a minimum temperature below 0°C, will fall by 2100 with the highest scenario: - 60 days for Europe, - 50 for the USA, - 80 for northern Russia, and up to - 140 days for the Arctic.
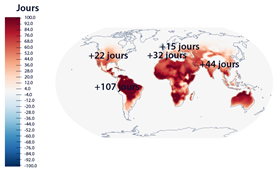
The opposite is true for the number of hot days, i.e. the number of days when the maximum temperature is above 35°C, which will increase by 2100 under the highest scenario: +15 days in Europe, +22 days in the USA, +32 days for the Mediterranean basin, +44 days for India, and up to +107 days for northern Latin America.
Even if the trends for the year 2100 have a larger uncertainty than for
temperatures, the precipitation extremes will also be modified with the highest
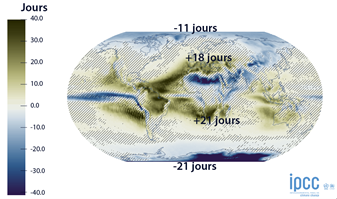
scenario. Let's first talk about the lack of precipitation: This map represents
the number of consecutive days without rain. We can see that once again, the
Mediterranean basin will see this number of days increase significantly with
+18 days per year. As for South Africa and a large part of Brazil as well as
its neighbouring countries where this increase is +21 days per year. On the
other hand, the number of consecutive days without precipitation will decrease
for the two poles: -11 days per year for the Arctic and -21 days per year for
the Antarctic.
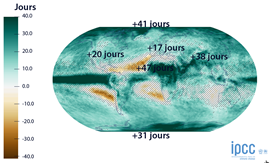
When air is warmer, it can hold more water vapor. So the clouds have more water available and therefore the extreme precipitation will also increase. This is what we see on this map. We can see that extreme precipitation will increase all over the planet.
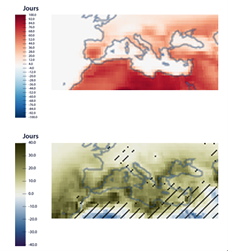
It should be noted that for the Mediterranean basin, even with a low scenario, i.e. a scenario that limits warming to +1.5°C, almost the entire Mediterranean basin will experience an increase in temperature and a concomitant decrease in precipitation and thus ultimately an increase in water stress over the entire basin. This will have obvious repercussions on agriculture and therefore on the food of the basin's populations.
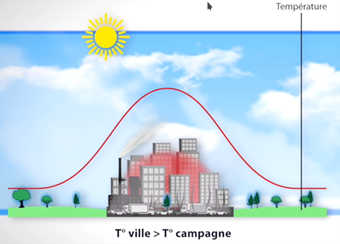
In Paris, for example, during the heat wave of 2003, the urban heat island was 10°C: Paris almost reached 40°C during the day, while some areas on its outskirts barely exceeded 30°C. At night, the center of Paris recorded lows of 25°C while the outskirts were around 17°C. These temperature extremes are obviously very harmful to human health. During the heat wave of August 2003, Paris recorded an excess mortality rate of +141% compared to +48% for the rest of France.
Knowing the principle and the consequences of urban heat islands, let's now come back to global warming. If we stay with the example of Paris, the city should experience an average temperature increase of +2°C to +6°C depending on the different warming scenarios.
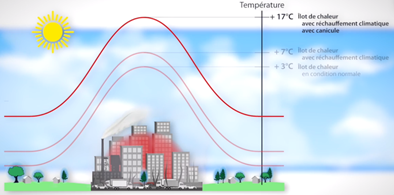
Let's go back to our diagram: Let's imagine a city in normal conditions, it has an urban heat island of +3°C compared to its periphery. Add to this heat island, the additional degrees due to global warming, the whole curve, city as well as periphery, rises by, say, 4°C. Add to this the excess heat due to a heat wave and we reach +17°C in the city. The temperatures obtained in the city will become almost lethal during certain periods of the summer. It is therefore more than urgent to protect our cities by reducing the amplification of the urban heat island.
It is not only the temperature that can change at the local level, but also the precipitation. Once again, urbanization will play a major role. Rainfall will not be absorbed in the same way in a rural environment as in an urban environment because the soils in the latter are much more artificial and therefore impervious to precipitation. Rainwater runoff in urban areas is therefore much more important than in rural areas.
To illustrate, let's take this image representing schematically the rural world, let's have a rainfall of 10mm which is the intensity of a good rain in temperate climate... Let's remember that a rainfall of 10mm is equivalent to having 10 liters of water per m² of ground surface... what will happen on our rural area? Well, half of it, that is to say 5mm, will infiltrate in the soil, 4mm will go back to the sky by evapotranspiration and only 1mm will run off on the surface.
Let's now take this image representing the urban world, and as before, let's have a 10mm rainfall. In this case, only 1.5mm infiltrates the soil, 3mm goes back to evapotranspiration and the rest, 5.5mm, runs off the surface towards low points. As the city has a lot of impervious surfaces, the water runs off and concentrates in the low points and in the drains until it reaches the nearest river.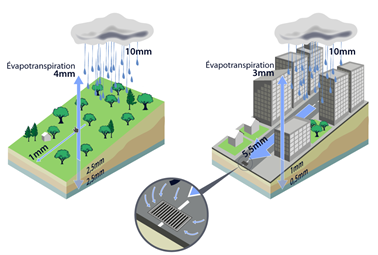
All these figures are relative to 1m². Do the calculation on a more or less large surface around you and these 5,5mm per m² accumulate and can become thousands of liters per drain.
Now let's get back to global warming. As we have seen, the intensity of precipitation will increase in summer in several regions of the world, including northern France and Belgium, to a greater or lesser extent depending on the warming scenario adopted.Let's take the two images, rural and urban, used previously and provoke a shower of 100mm, or 100 liters of water per m². This may seem enormous, but it is the equivalent of what falls during an intense thunderstorm in temperate regions over 1 to 2 hours.
The problem with such intense rainfall is that huge amounts of water arrive in a short period of time. Even in rural areas, soils will have less efficient infiltration, and the amount infiltrated will depend on the characteristics of the soil. In urban areas, however, it is much clearer. Whether the rain is light or heavy, the impervious pavement continues to have zero infiltration, so 55mm of the 100mm will run off. And probably even more because the few soils that allow infiltration will be quickly saturated and will therefore transfer these quantities of non-infiltrated water in surface runoff. As for evapotranspiration, it will only change slightly. Thus, we will have more than 55mm of surface runoff per m², that is to say tens of thousands of liters for a few hundred m². The gutters and sewers can no longer absorb all this runoff and so the water is forced to go another way, usually roads, as here in Dinant, Belgium, during a storm event of 80mm over one hour in August 2021.
VIDEO →
Intense rainfall, favored by global warming, combined with the sealing of soils will therefore increase the risk of flooding by overflow, causing material damage or human casualties in the worst case.
Through these two examples, of heat waves and intense rainfall, we have just seen that our choices at the local level, particularly in terms of urbanization and soil management, have a significant impact on the consequences of global warming, which will be amplified in urban areas. It is therefore urgent to get around the table to develop solutions, including in schools, such as reducing the artificialization of soils to increase water infiltration or planting more vegetation in cities to reduce the effect of the urban heat island.