Module 4.3 Reading
Human activities are emitting more and more greenhouse gases that increase the greenhouse effect and ultimately the global temperature of the Earth. This chapter will focus on how much of the global warming is actually due to human activities versus how much is natural warming. We will also see other factors that impact on climate that are also human in origin.
First of all, I think this is the time to challenge a widely held belief that we are in a natural warming phase and therefore, humans have not played a significant role in the current warming of the climate. This is not true and I will prove it to you thanks to climate modeling!
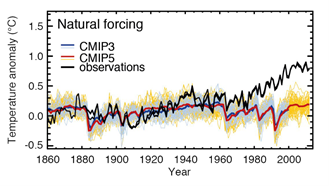
Let's first take this figure where you can discover the temperature anomaly observed over the period 1860-2010 in the black line. This curve is the global warming as observed with an increase of almost 1°C between 1900 and 2000.
Now, thanks to modeling, we will try to simulate this temperature evolution as well as possible. First, we do not take into account the greenhouse gas emissions produced by human activities. The colored curves represent the temperature anomaly simulated by several climate models that only take into account natural factors such as the astronomical configuration of the Earth and its orbit around the sun, solar activity and volcanic activity. We note that the simulations succeed in correctly representing the observations until the 1930s. On the other hand, for the rest of the 20th century, the simulated temperatures do not represent the observed temperature evolution. At this stage, we can say that the natural forcing alone can not explain the temperature increase.
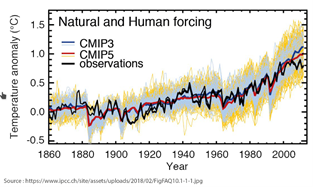
In a second step, let's add to the natural forcing the anthropogenic forcing, i.e. the greenhouse gas emissions due to human activities, the changes in land use and all other human activities impacting on the climate. Here is what we get: the colored curves still represent the temperature anomalies simulated by the different models, but this time they are able to represent the observed temperatures over the whole period. Therefore, without the addition of the anthropogenic forcings in the models, they are not able to represent the observed temperature evolution.
The same exercise can be done in two dimensions: first, let's take a map of the global temperature trend between 1951 and 2010. In a few places, we see a generalized warming over the entire planet. Now, let's simulate this trend using models with only natural forcing. We get this map with a weakly negative or positive trend depending on the location. So it doesn't represent the observed trend at all. Now let's simulate the trend by adding anthropogenic forcing, and we get this map. Even if regionally there are some discrepancies, we can see that globally, the simulation where we take into account both natural and anthropogenic forcing is much closer to what is observed.
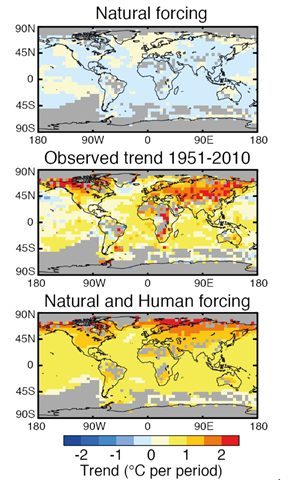
This modeling exercise teaches us two important things:
First, the evolution of current temperatures can only be explained by taking into account both natural and anthropogenic causes. Second, the part of warming related to human activities is much larger than the part of warming related to natural forcing alone. In this case, over the period 1951-2010, the temperature increase related to natural activities is less than +0.1°C while the increase attributed to human activities is between +0.5 and +1.3°C.
Among these human activities, we are entitled to ask which ones produce greenhouse gases?
It is obviously complex to account for the share of each economic sector. Moreover, the figures vary according to the calculation method used. Based on the 100-year global warming potential, the 6th IPCC report proposes the following breakdown:
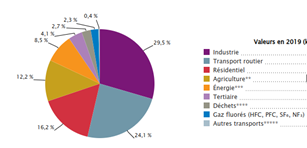
At the global level in 2019, the most emitting economic sector is the industry sector with 24% followed closely by the electricity and heat production sector with 23% of global CO2 equivalent emissions. Next is the sector comprising agriculture, forestry and anthropogenic land use activities, including forest fires, deforestation, peat fires, etc., which is the third largest emitter of greenhouse gases with 22%. This is followed by emissions from the transport sector (with 15%) and buildings (with just under 6%). Finally, various activities related to the energy sector for 10%. Of course, all these figures are to be considered with their margin of error.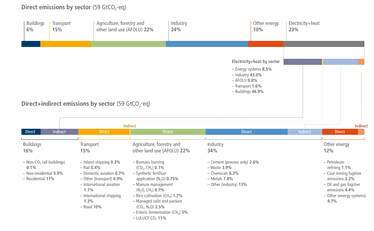
Nevertheless, if we look at the figures in a relative way, it is interesting to compare these global emissions with more regional emissions. Thus, if we analyze the emissions of each sector on the same basis of calculation (i.e. the Global Warming Potential at 100 years) not for the whole world but this time for the Walloon region in Belgium in 2019: we notice that industry is also in first position with almost 30%, then it is the transport sector which comes in second position with more than 24% followed by residential with more than 16%. Then come the agricultural sector, electricity production and various other economic sectors.
When we talk about greenhouse gas emissions, it is therefore interesting to understand what we are talking about because the figures are different depending on the geographical area studied. Therefore, efforts to reduce emissions will have to be established differently for each country.
And what about schools emissions ?
It is difficult to answer this question. As we have just seen, the emissions are very different from one country to another, from one region to another... This will also be the case from one school to another.
However, if we identify the areas that schools use in their daily life, we can say that : Schools are part of the tertiary sector (4% of the GHG emissions) which is a sector with low greenhouse gas emissions but students use transport to go to school (24% of the GHG emissions), schools use energy (8%) to heat their classrooms, for lighting, for computers etc, schools also produce wastes (3%), canteens of school use agricultural products (12%), the school furniture are made by industries (29%). Thus, even if schools are not the largest emitters when only the sector in which they are included is taken into account, it can be seen that when all indirect emissions are taken into account, they can produce a lot of greenhouse gases. In another sense, schools also have a lot of power to reduce their greenhouse gas emissions.
Going further and not limiting ourselves to greenhouse gas emissions
In the human
activities that influence the climate, there are not only greenhouse gas
emissions, there are also aerosol emissions, contrails left by airplanes, but
also land use changes.
Let's take each element one by one:
- Aerosols play a double game that is still poorly evaluated. On the one hand, they will participate in a climatic cooling since, on the one hand, they will play a role of sunshade by reflecting part of the solar radiation and, on the other hand, a role of condensation nucleus favoring the appearance of clouds. So, in both cases, they will reduce the solar radiation received at the surface but on the other hand, they will also absorb solar radiation and thus strengthen the greenhouse effect by the emission of infrared radiation. This double game makes them one of the main sources of uncertainty in the estimation of their influence on global warming.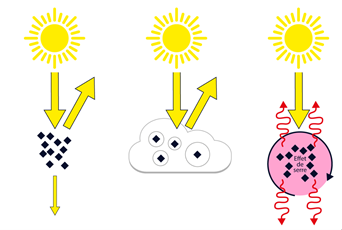
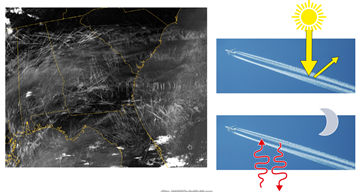
- The contrails left by airplanes may seem anecdotal, but they are not. These long clouds formed by ice crystals can, depending on the weather conditions, cover a large geographical area as shown here over the southeastern United States. These trails will play a different role during the day and night. During the day, the trails will reflect the sun's rays and thus contribute to the cooling of the atmosphere. On the other hand, at night, these same trails will accentuate the greenhouse effect and reflect infrared radiation back to the ground.
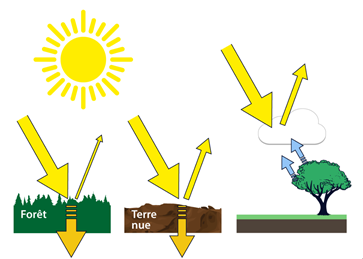
- Even if the impacts are more local than global, changes in land use due to urbanization, deforestation or reforestation, for example, will have a slight impact on global warming, mainly by modifying the albedo of the soil. But the impacts are complex. Let's take the example of deforestation: if we replace a forest by bare soil, we will increase the albedo of the soil from 0.15 to 0.30. Thus, the solar energy absorbed by the ground will decrease since a greater part will be reflected towards space. A local cooling will therefore occur. On the other hand, trees, through their evapotranspiration, provide huge amounts of moisture to the atmosphere, which leads to the formation of clouds. These low clouds will also reflect some of the radiation back to space preventing the ground from warming up. By deforesting, we remove these low clouds and thus reinforce the local warming. Furthermore, on a global scale, removing trees that are carbon sinks will indirectly increase the concentration of greenhouse gases in the atmosphere and thus increase global warming. These complex reactions occur for any change in land use, such as when we urbanize grassy areas or even when we reforest a region. The local radiation balance is systematically modified, sometimes with global consequences.
It is therefore obvious that this "land use" factor is very complex to understand, with sometimes antagonistic effects as we have just seen. It appears that, as for aerosols, the uncertainty of these land cover changes is also important for its estimation in the total global warming.
It is therefore obvious that this "land use" factor is very complex to understand, with sometimes antagonistic effects as we have just seen. It appears that, as for aerosols, the uncertainty of these land use changes is also important for its estimation in the total global warming.
If we aggregate all the anthropogenic forcings and compare them to the natural forcing, we get this graph.
The first line shows all the forcing related to the different greenhouse gases,
The second line includes the other anthropogenic forcings such as aerosols, land use, etc.
The third line presents a balance of the forcings linked to human activities.
And finally, the fourth line groups together the natural forcings such as solar energy and volcanic activity.
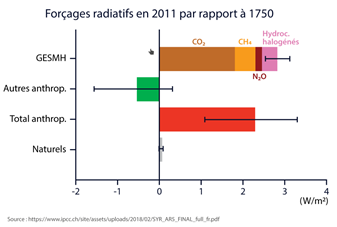
The figure is very clear: Even taking into account the margin of uncertainty, human activities participate almost entirely in global warming.