Module 1.3: Reading
Project planning steps
Project planning in school programs is the process of creating a detailed plan for the implementation of a specific educational project or initiative. This involves defining the scope, objectives, and outcomes of the project, as well as identifying the necessary resources, such as materials, equipment, knowledge, persons to be involved, and timeline for completion. It is important to involve all relevant stakeholders, such as teachers, administrators, parents, members of the local community if needed and students, in the planning process to ensure buy-in and alignment on project goals and objectives. Effective project planning in schools requires clear communication and collaboration among team members and the use of project management tools and techniques to ensure the project stays on track and successful.
It is also important to align the project with the school's overall educational goals and objectives, and to consider the needs and capabilities of the students who will be participating in the project. This includes assessing the students' prior knowledge and skills, as well as their learning styles and needs, to ensure that the project is tailored to their abilities and interests.
Additionally, project planning in school programs should also consider the integration of technology and other tools that could enhance the students' learning experience and facilitate the achievement of the project goals.
Project planning step by step.
Project planning involves creating a detailed roadmap for achieving specific project objectives within a defined timeframe and budget.
A Work Breakdown Structure (WBS) is a hierarchical representation of the tasks and subtasks required to complete a project. It is a visual tool used to organize and divide a project into smaller, manageable components.
Gantt charts are a type of bar chart that illustrates the start and end dates of various tasks and subtasks in a project. They are used to visualize the project schedule and track progress.
WBS and Gantt charts are often used in combination to provide a comprehensive overview of a project's scope and timeline.
Creating a WBS and Gantt chart at the beginning of a project can help project managers identify potential risks and issues, and make adjustments as needed to stay on schedule and within budget.
Updating the WBS and Gantt chart regularly throughout the project can help ensure that tasks are completed on time and that the project stays on track.
Work breakdown structure (WBS)
As mentioned WBS structure is a visual tool-technique used to make the work more manageable and approachable. It helps to integrate scope and schedule baselines. According to the complexity of the project there is a different need for levels. (Figure 4)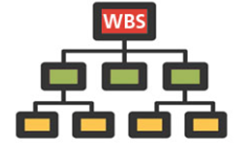
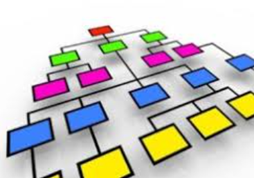
Figure 4: Different WBS structures in terms of levels
Level 1 elements or in other words the top row(green boxes) are summary deliverable descriptions that must capture 100% of the project scope. The process continuous by decomposing more the level 1 elements until the work covered in each Element is managed by a single person or team. The rule about when this decomposition ends is whenever there is not something more that would simplify the workload. The lowest Level Elements (yellow boxes) in the WBS are called Work Packages (WP).
Word packages (WPs) except that should be easily manageable as the key elements, performing them the 100% of the scope should be covered. This is why the creation of a WBS Dictionary, in other words a WP description in words will be helpful.
WBS Dictionary is a narrative description of the work covered in each Element in the WBS and especially in the ground levels. The descriptions should include information such as, boundaries, milestones, risks, owner, costs, etc. Additionally this description ensures that the task will not change throughout the project from outside factors for example stakeholders desires without have been evaluated. Without a WBS Dictionary, the project does not have a complete baseline and cannot measure or monitor scope performance.
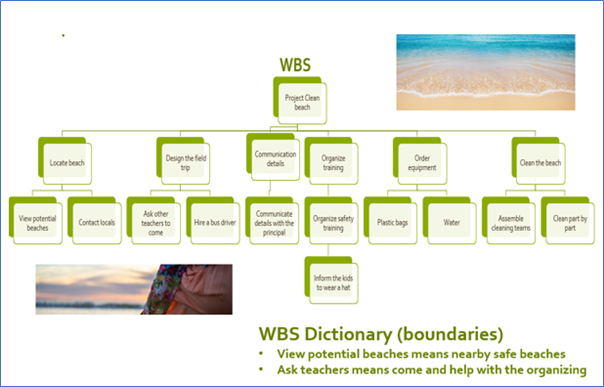
Figure 5: Example of WBS in a simple green project
Level 1 components, word packages and WBS Dictionary constitute the scope baseline and the above figure (Figure 5) is a very simple example of application in a green school project. The Work Breakdown Structure can be exported into a Gantt chart for further scheduling and project tracking.
What from the above you need to describe the project scope baseline and think of other reasons why WBS dictionary is very important?
Gantt Charts
A Gantt chart is a tool used in project management to aid in the planning, scheduling, and monitoring of a project. By utilizing a Gantt chart, teachers can enhance their planning and scheduling, as well as improve collaboration among remote workers, task delegation, and resource allocation. In school projects a Gantt Chart is an easy-to-use tool to see what has to be finished before starting something else and to check if everything goes well upon schedule
The chart presents all information in a visual format, using a horizontal bar graph, which allows project managers and team members to easily view task schedules, dependencies, and progress at a glance. By planning all tasks in advance and displaying them in one place, teams are empowered to complete their project on time.
The tasks, which are usually the work packages, are represented on the Y axis of the Gantt Chart, with its duration on the X axis. Each task is represented by a bar. The length of the bar represents its duration. If you see two bars overlapping on the X axis, you know that they occur simultaneously.
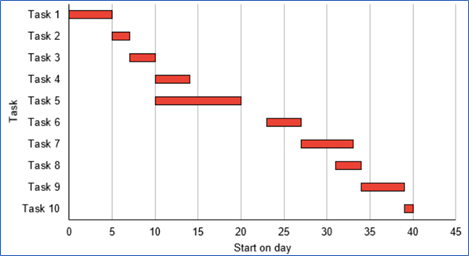
Figure 6: Gantt chart example
As you can see in this example (Figure 6), a Gantt chart enables project managers to have a quick view of project information like:
List of tasks that comprise a project
Start and end dates for each task
Dependencies between tasks
Scheduling
Progress of each task
Person responsible for each task
A Gantt chart proves useful in keeping a project on track, especially when you have multiple dependencies and many tasks happen simultaneously.
There is also other charts that helps you with the time management of the project, what are the main pros of a Gantt Chart?